
Journal
Reading the curve, not the number
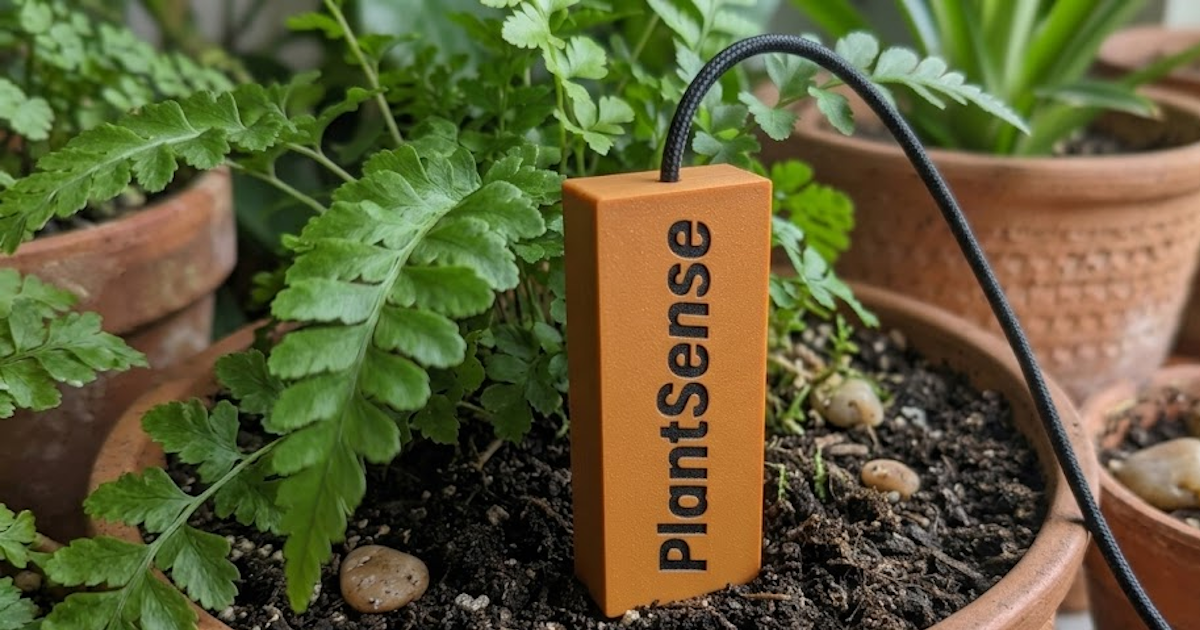
Most people check a moisture reading the way they check a thermometer: glance, decide, move on. That works, but it leaves the most useful information on the table.
The curve is the interesting part
Water a bed properly and watch it over the following days. The reading climbs to its wet point, holds for a while, then falls away. How fast it falls, and the shape of that fall, tells you things a single number cannot.
A steep, straight drop means the soil holds very little. Usually sandy, or a container too small for the plant in it. A long plateau followed by a sharp cliff often means the surface is capped or compacted, so water ran off rather than soaking in.
A gentle, gradually flattening curve is what you want. It means the soil is holding moisture and releasing it steadily, which is exactly the environment roots like.
Seeing the curve at all means keeping a bit of history. If you run Home Assistant your monitor charts there automatically, and PlantSense Cloud keeps the same history for you to look back over a week or a season from anywhere.
What to do with what you see
Fast drop: add organic matter over winter, mulch the surface now, and water more often in smaller amounts rather than trying to fix it with volume.
Water not soaking in: break the surface crust with a fork before watering, and water slowly. A soaker hose beats a can here.
Never really drying: check drainage before you congratulate yourself. Permanently high readings in a container usually mean the pot is sitting in water, and roots suffocate in soaked soil just as surely as they shrivel in dry.
Setting a threshold from the curve
Once you have watched a full cycle, you know where on the curve your plants started to look unhappy. That figure, not a number from a chart, is where your watering threshold belongs. It is specific to your soil, your plant and your climate, which is the whole point.
You can set that figure by hand on the monitor, or start from a tested one and adjust. Every plant in our plant database carries a watering threshold worked out from irrigation data, which makes a sensible starting point before you fine tune it to what you have actually seen in your own beds.
New to this? The setup guide walks through calibrating to your soil and choosing your plant, which is where the curve starts to mean something.
Leave a comment